2024. november 21. csütörtök
IDŐJÁRÁS - angol nyelvű folyóirat

Vol. 127, No. 1 * Pages 1–142 * January - March 2023
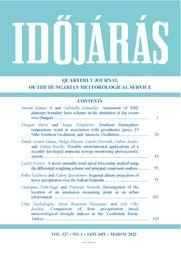

Journal of the Hungarian Meteorological Service

letöltés [pdf: 5762 KB]
Assessment of WRF planetary boundary layer schemes in the simulation of fog events over Hungary
Jeevan Kumar B and Gabriella Schmeller
DOI:10.28974/idojaras.2023.1.1 (pp. 1–22)
 PDF (9323 KB)   |   Abstract

Accurate depiction of meteorological conditions, especially within the planetary boundary layer (PBL), is essential for fog forecasting. This study examines the sensitivity of the performance of the Weather Research and Forecast (WRF) model to the use of four different PBL schemes [Yonsei University (YSU), asymmetric convective model version 2 (ACM2), quasinormal scale elimination (QNSE), and Mellor-Yamada-Nakanishi-Niino version 3.0 (MYNN3)]. For this case study we have taken the fog event occurred in November 23-24, 2020. Surface observed temperature and relative humidity, furthermore, sounding data are compared with the output of the 36 hours, high-resolution weather forecast. The horizontal extension of the simulated fog is compared with satellite observations. The visibility is calculated from the prognostic variables of drop number concentration and mixing ratio. The simulated visibility and fog duration are validated by the visibility and fog duration evaluated by ceilometer observations. Validation of thermodynamical values such as 2-m temperature and relative humidity reveals, that during most of the simulation time, the bias is significant between the simulated and observed data. Results show that the PBL parameterization scheme significantly impacts fog microphysics also. The QNSE scheme results in unrealistic early formation of the fog, and too large liquid water content. YSU and ACM2 simulated the duration of fog to be rather short comparing with the other two PBL schemes. The best fitting with observed data is found in the case of MYNN3 PBL schemes.


Southern Hemisphere temperature trend in association with greenhouse gases, El Niño Southern Oscillation, and Antarctic Oscillation
Dragan Burić and Ivana Penjišević
DOI:10.28974/idojaras.2023.1.2 (pp. 23–42)
 PDF (1787 KB)   |   Abstract

In this study, the trend of mean seasonal and annual temperatures of the Southern Hemisphere was calculated based on the HadCRUT5 and NASA-GISS data networks, for the period 1901–2021 and 1951–2021. In order to determine the possible effects on temperature, man, or nature, the relationship with CO2 concentration, GHG (greenhouse gases) radiation exposure, and teleconnections ENSO (El Niño Southern Oscillation) and AAO (Antarctic Oscillation) was examined. The obtained results indicate that there is a significant increasing trend of seasonal and annual temperatures in the Southern Hemisphere, which intensified in the period between 1951 and 2021 (from 0.11 to 0.12 °C per decade). According to climate models, one of the indicators of the dominance of the anthropogenic greenhouse effect is the polar amplification (more intense temperature rise going from the equator to the poles). However, polar amplification was not recorded in the Southern Hemisphere, due to the fact that there was the smallest increase in temperature in the belt between 44°S–64°S. Moreover, in the mentioned zone, the positive trend was smaller in the period between 1951 and 2021 than in the period between 1901 and 2021, which was not to be expected. Nevertheless, the Southern Hemisphere temperature showed a statistically significantly strong correlation with the concentration of CO2observed at the Mauna Loa station. It was also found that there is a significant relationship between the energy impact of greenhouse gases and the Southern Hemisphere temperature, which is logical, because with the growth of GHG, positive radiative forcing increases. When it comes to the impact of telecommunications, both considered teleconnections (ENSO and AAO) have an impact on changes in the temperature of the Southern Hemisphere.


Possible environmental applications of a recently developed ammonia isotope monitoring photoacoustic system
Emily Awuor Ouma, Helga Huszár, László Horváth, Gábor Szabó, and Zoltán Bozóki
DOI:10.28974/idojaras.2023.1.3 (pp. 43–53)
 PDF (688 KB)   |   Abstract

Ammonia is one of the most significant environmental pollutants. Concentration measurements, identifying the sources and studying the transformations in the biosphere are essential, and they are the focus of many investigations. The near-infrared (≈1530 nm) photoacoustic method for simultaneous and selective determination of 14NH3/15NH3 isotopologues reported here can be suitable for monitoring these phenomena and processes. So far, the photoacoustic method has not been used for this kind of examination. The application of our measurement method makes it possible to eliminate the disadvantages of the previous measurement methods. The detection limit of the PA system is 0.14 ppm and 0.73 ppm for 14NH3 and 15NH3, respectively, which can be improved by orders of magnitude with further development of sampling and measurement techniques.


A novel ensemble wind speed forecasting method using the differential weighting scheme and principal component analysis
Laleh Parviz
DOI:10.28974/idojaras.2023.1.4 (pp. 55–76)
 PDF (1360 KB)   |   Abstract

Wind speed forecasting has found economic significance as it can increase operational efficiency. In this regard, an accurate forecast of wind speed is crucial in the application of wind resources. This study is intended to incorporate independent and output variables as the input of support vector regression (SVR) to forecast wind speed of Zanjan and Ahvaz stations in Iran. The independent variables were minimum, maximum, and mean temperatures, relative humidity, precipitation, average visibility, and dew point temperature. The incorporation of independent and output variables were conducted with principal component analysis (PCA) and differential weighting scheme (DWS), respectively. DWS combined the forecasts of linear regression, SVR, and group method of data handling (GMDH) in which the SVR showed the best The forecast of DWS outperformed the other three mentioned models. The incorporation of DWS and PCA (DWS-PCA) improved the forecasts and the capability of DWS-PCA as a novel method was significant in terms of forecast stability. The novel method can be a robust approach for wind speed forecasting in some subjects such as renewable energy, and meteorological decisions.


Regional climate projections of heavy precipitation over the Balkan Peninsula
Rilka Valcheva and Valery Spiridonov
DOI:10.28974/idojaras.2023.1.5 (pp. 77–106)
 PDF (4540 KB)   |   Abstract

This article presents climate change projections of heavy (above a certain threshold) precipitation under the Representative Concentration Pathways RCP4.5 and RCP8.5 for the territory of the Balkan Peninsula. The focus is on convective rainfall which, if significant, can damage infrastructure and cause casualties. For this purpose, RegCM4.4.5 regional climate model with 20 km resolution was used for the periods 2021–2050 and 2071–2099 compared with the reference period 1975–2004. The change in the number of heavy rainfalls is determined by using the thresholds in the Meteoalarm program corresponding to the ‘yellow’ code. It is found that the largest changes in the number of convective precipitation events are in the coastal and mountainous areas. The increase in the number of cases of heavy rainfalls does not exclude the decrease in the amount of precipitation in these areas. This can be explained by the increase in the period in which these precipitations are possible due to the increase in temperatures.


Investigation of the location of an immission measuring point in an urban environment
Georgina Tóth-Nagy and Fruzsina Németh
DOI:10.28974/idojaras.2023.1.6 (pp. 107–122)
 PDF (4024 KB)   |   Abstract

Life could not exist on Earth without air; this is why its protection is so important. However, air pollution has been known since ancient times, nowadays pollutants from anthropogenic sources occur in much higher quantities. Previously, the primary emission sources were factories due to the industrial revolution, then the development of transportation and the presence of internal-combustion engines made air pollution a major issue. Therefore, more and more efforts have been made over the last decades to reduce the emissions of air pollutants in the industrial sector and the everyday life of the population. Because of this, it is essential to know the factors influencing the air quality of the settlement and to monitor the pollutants properly. Therefore, within the framework of the research work, we examined the possibilities of placing an immission measuring point. To do that, we needed to explore the most important characteristics of the town. Therefore, we examined its structure, meteorological and climatic factors, which fundamentally affect the air quality. We made immission maps using a Geographical Information Program (QGIS) based on the received data. Finally, based on the results, we examined the possibilities of placing an immission measuring station.


Comparison of four precipitation based meteorological drought indices in the Yesilirmak Basin, Turkey
Utku Zeybekoglu, Alyar Boustani Hezarani, and Aslı Ulke Keskin
DOI:10.28974/idojaras.2023.1.7 (pp. 123–142)
 PDF (2988 KB)   |   Abstract

Drought, which is often defined as not enough precipitation, does not a mean simple lack of precipitation. This condition, which occurs when humidity is less than the average value for many years, is caused by a disrupted balance between precipitation and evaporation in a region. It is very difficult to predict the start and the end time of drought. In the present study, the drought conditions of the stations selected from Yesilirmak Basin between 1970 and 2014 were determined by using Z-Score Index (ZSI), China-Z Index (CZI), Modified China-Z Index (MCZI), and Standard Precipitation Index (SPI), and the compliance of these indices to the SPI was investigated. It was determined that these indices gave parallel results to each other, and SPI detected drought earlier than other indices.


IDŐJÁRÁS folyóirat