2024. november 23. szombat
IDŐJÁRÁS - angol nyelvű folyóirat

Vol. 123, No. 4 * Pages 409–576 * October - December 2019
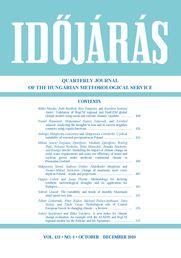

Quarterly Journal of the Hungarian Meteorological Service

Special compilation: Environmental challenges – Smart solutions

letöltés [pdf: 3546 KB]
Validation of RegCM regional and HadGEM global climate models using mean and extreme climatic variables
Ildikó Pieczka, Judit Bartholy, Rita Pongrácz, and Karolina Szabóné André
DOI:10.28974/idojaras.2019.4.1 (p. 409–)
 PDF (3932 KB)   |   Abstract

The horizontal resolution of global climate models (GCMs) is still too coarse to evaluate regional climatic differences, therefore, to analyze regional environmental changes, it is essential to downscale the GCM simulation results. One of the methods widely and most often used for this purpose is dynamical downscaling. In the present paper we examine the ability of a specific global (HadGEM2-ES) and a specific regional climate model (RegCM) to describe present climatic conditions in different geographical areas within the Med-CORDEX domain. Our main goal with this validation is to inform researchers, who are planning to complete climate change impact studies about the major characteristics of the simulation outputs, serving as important input in such studies. So we analyzed annual and seasonal mean fields, mean error fields relative to the reference measurements, and selected climate indices. On the basis of the results, dynamical downscaling generally cools the HadGEM results, which depends on the distance from the ocean, and orography. A clear improvement can be recognized in the root-mean-square error (RMSE) of temperature indices when using finer resolution. Moreover, dynamical downscaling with higher resolution often increases the precipitation in mountains. Furthermore, in order to quantify the potential added value of RegCM simulations, a complex measure was introduced to take into account both the magnitude and spatial extent of bias. The analysis shows a general improvement in the cold-related indices in Central Europe and all temperature-related climate indices in Western Europe. The influence of model resolution is usually so strong, that it results in the underestimation of precipitation indices changing into overestimation and vice versa.


Analyzing the droughts in Iran and its eastern neighboring countries using copula functions
Yousef Ramezani, Mohammad Nazeri Tahroudi, and Farshad Ahmadi
DOI:10.28974/idojaras.2019.4.2 (p. 435–)
 PDF (2576 KB)   |   Abstract

As a long-term water deficit condition, drought is a challenging issue in the management of water resources and has been known as a costly and less known natural disaster. Monitoring and predicting droughts, especially accurate determination of their beginning and duration are crucial in management of water resources and planning for mitigating the damaging effects of drought. In this study, the droughts in the southwestern region of Asia (Iran, Afghanistan, Pakistan, and Turkmenistan) were evaluated using the joint deficit index (JDI). Data of monthly and annual precipitation of 1392 downscaled rain gauge stations (by using the Bias Correction Spatial Disaggregation (BCSD method) within the statistical period of 1971-2014 were employed to calculate JDI. The results indicated that in recent years, the number of dry months in the studied region (especially in humid regions of Iran) has significantly increased, such that across all regions in Iran, the percentage of dry months has reached over 50%. The results also showed that in addition to scientific description of the general drought condition, JDI is also able to specify the time of beginning of droughts as well as long-term droughts, allowing investigation of the drought condition on a monthly scale. The results of investigating the trend of changes in the JDI values in the studied region revealed that the variations in these values have decreased on annual scale in the studied region. The extent of reduction in JDI and the increase in the number of dry months within the statistical period of 1971–2014 have been significant (at level of 5%) in Iran, suggesting increased drought in Iran, especially during winter. The values of monthly and annual precipitation in the studied region have been descending, where among the studied countries, Iran has experienced the maximum extent of reduction in precipitation.


Cyclical variability of seasonal precipitation in Poland
Jadwiga Nidzgorska-Lencewicz and Małgorzata Czarnecka
DOI:10.28974/idojaras.2019.4.3 (p. 455–)
 PDF (926 KB)   |   Abstract

The aim of the present paper was an attempt to detect the recurring fluctuations in the course of seasonal sums of precipitation in Poland. The basic material consisted of monthly sums of atmospheric precipitation obtained from 37 IMGW-BIP weather stations from the period 1951 – 2016, excluding the mountain areas. Spectral analysis was performed concerning precipitation sums in the four calendar seasons: spring (March  May), summer (June  August), autumn (September  November), winter (December – February). The results of the spectral analyses showed that the changes in seasonal precipitation sums recorded in the analyzed multiannual period occurred in numerous, statistically significant cycles, with a clear predominance of the cycles with the following length: 4.0, 4.6, 4.9, 5.3, 5.8, 6.4, and 7.1 years. It was found that the winter season is characterized by the most pronounced cyclicality (cycles of 6.4 years), whereas the spring season is marked by the highest variability in terms of periodicity.


Modeling the impact of climate change on yield, water requirements, and water use efficiency of maize and soybean grown under moderate continental climate in the Pannonian lowland
Milena Jancic Tovjanin, Vladimir Djurdjevic, Borivoj Pejic, Nebojsa Novkovic, Beba Mutavdzic, Monika Markovic, and Ksenija Mackic
DOI:10.28974/idojaras.2019.4.4 (p. 469–)
 PDF (833 KB)   |   Abstract

In Central and Eastern Europe, climate changes have been predicted (Trnka et al., 2009). These changes are expected to have a great impact on field crops during the spring-summer growing season. The aim of this paper is to estimate the impact of climate change on the main field crops (maize and soybean) in the Republic of Serbia. The AquaCrop model was used as a tool to quantify climate change impact on yield and net irrigation using results from the ECHAM climate model (SRES A2 scenario for the 2041–2070 and 2071–2100 periods) and data from two experimental fields located in the southern part of the Pannonian lowland. The analyzed results for the 2041–2070 and 2071–2100 periods showed an increase in maize (1 and 1.3 t/ha) and soybean (1.9 and 2.8 t/ha) yields and a very significant increase in the net irrigation of 151.4 and 183.1 mm in maize production and 179.3 and 227.3 mm in soybean production under climate change conditions compared to the 1961–1990 period. Additionally, irrigation water use efficiency was calculated to estimate the importance of irrigation, because crop production is usually conducted under rainfed conditions. It was concluded that maize and soybean production should benefit from climate changes but with higher water quantities.


Change of maximum snow cover depth in Poland – trends and projections
Małgorzata Szwed, Andreas Dobler, Abdelkader Mezghani, and Tuomo Mikael Saloranta
DOI:10.28974/idojaras.2019.4.5 (p. 487–)
 PDF (2543 KB)   |   Abstract

The present paper examines the observed variability of maximum depth of snow cover in Poland and its projections for near (2021–2050) and far (2071-2100) future. The study makes use of a set of 43 time series of observation records from stations in Poland, from 1951 to 2013. For the future, two downscaling experiments were conducted with the aim of producing reliable high-resolution climate projections of precipitation and temperature for Poland. The results of these projections were used as the input data to the seNorge snow model in order to transform bias-adjusted daily temperature and precipitation into daily snow conditions. Observed behavior of time series of snow is complex and not easy to interpret. The changes (if any) are dominated by strong inter-winter and intra-winter variability, rendering trend detection difficult. Projected seasonal snow cover depth (for winter as well as spring and autumn) as simulated by the snow model for the near and far future show decreases. The rate of decreasing maximum snow depth is expected to at least double by 2071–2100.


Methodology for deriving synthetic meteorological droughts and its application for Budapest
Ognjen Gabrić and Jasna Plavšić
DOI:10.28974/idojaras.2019.4.6 (p. 501–)
 PDF (2457 KB)   |   Abstract

In the recent years, nearly every part of Central Europe and the Balkans has experienced periods of reduced precipitation that can lead to droughts. Because of the complexity of the phenomenon and the different points of view from which the problem can be studied, it is difficult to decide when the drought started or when it ended. This paper presents a methodology for a stochastic analysis of meteorological droughts. This method is applied to precipitation and temperature data observed at a meteorological station of Budapest for the period of 1900–2000. The drought is defined as a consequence of a combined effect of temperature and prolonged dry period – consecutive days with daily precipitation below a chosen threshold for precipitation. The statistical analysis of the maximum meteorological droughts is performed by means of the peaks-over-threshold (POT) method. The proposed methodology provides probability distributions of the magnitude of droughts in terms of dry period duration and air temperatures, which can then be used to formulate synthetic design droughts for selected return periods.


The variability and trends of monthly maximum wind speed over Iran
Sohrab Ghaedi
DOI:10.28974/idojaras.2019.4.7 (p. 521–)
 PDF (6571 KB)   |   Abstract

The maximum wind speed trends over Iran were analyzed based on the data recorded at 49 synoptic stations in Iran, including at least 40 years of data. The regions with maximum winds in Iran are most often seen in the Zagros Mountain. The nonparametric Mann–Kendall test at 95 % level of significance was used to survey whether there is a trend for the maximum wind speed data. Sen’s slope estimator was also used to determine the magnitude of the trends. The results reveal that the rate of positive trend is much higher than the negative trend and, in some months, it reaches more than 57% throughout the territory of Iran. Line slope is positive in 86.7% of the country’s area. The increasing wind speed can have significant negative impacts on installations and structures, erosion, human health, evapotranspiration, and wind energy.


Hydrological role of Central European forests in changing climate –review
Zoltán Gribovszki, Péter Kalicz, Michael Palocz-Andresen, Dóra Szalay, and Tünde Varga
DOI:10.28974/idojaras.2019.4.8 (p. 535–)
 PDF (1173 KB)   |   Abstract

Climate change exerts one of the most relevant impacts on hydrological processes by altering precipitation patterns and evapotranspiration processes. Forests, the terrestrial ecosystems with the highest water demand, will likely be the most influenced by the changing water regime. The study aims to outline the vital role forests play in the global water cycle, a role that increases as climate change intensifies. The deforestation that has occurred in recent years is a main trigger of global climate change, one that negatively affects climate-sensitive areas. The study focuses on the importance of crown and litter interception as well as the manner in which climate change alters these. We also present some results for forest and groundwater relations in Hungary and the impact of forests on runoff during extreme weather conditions.


A new index for climate change evaluation – An example with the ALADIN and RegCM regional models for the Balkans and the Apennines
Valery Spiridonov and Rilka Valcheva
DOI:10.28974/idojaras.2019.4.9 (p. 551–)
 PDF (2155 KB)   |   Abstract

A new index for climate change assessment has been introduced. It is a ratio between the number of cases from a future period and the cases of a control experiment (reference period) falling within a predefined interval of the reference period. By "case" we mean the value of a meteorological element that meets certain conditions. Additionally, its conservation is a necessary condition for reducing the risk of losing a reliable signal of the modeled variability of future climate when applying bias correction methods (BCM’s). The spatial distribution of this index is presented by using two regional climate models, ALADIN and RegCM4, over an area including the Balkan and Apennine Peninsulas. The assessment is performed for the average monthly temperature and precipitation. Both models have similar indices in broad areas. In winter, spring, and summer this refers to temperature and in spring and summer to rainfall.


IDŐJÁRÁS folyóirat