HAWK-3 is the OMSZ’s own developed and operationally used visualisation tool, which makes possible review of huge amount of meteorological information for the forecasters at their work. Raw data are depicted on map, thermodynamic diagrams, vertical spatial cross section and vertical time section. The special visualisation functions make the software an efficient tool for reviewing the progress of weather and numerical predictions.
HAWK-3 runs under Linux operating system. The software is able to work principally with file formats, used at OMSZ, where most of the data are stored in NetCDF, HDF and simple binary files. The continuous data refreshing generates more than a hundred GB traffic per day due to the high resolution grid data of numerical models and high resolution satellite images, accordingly the software works with a huge amount of data.
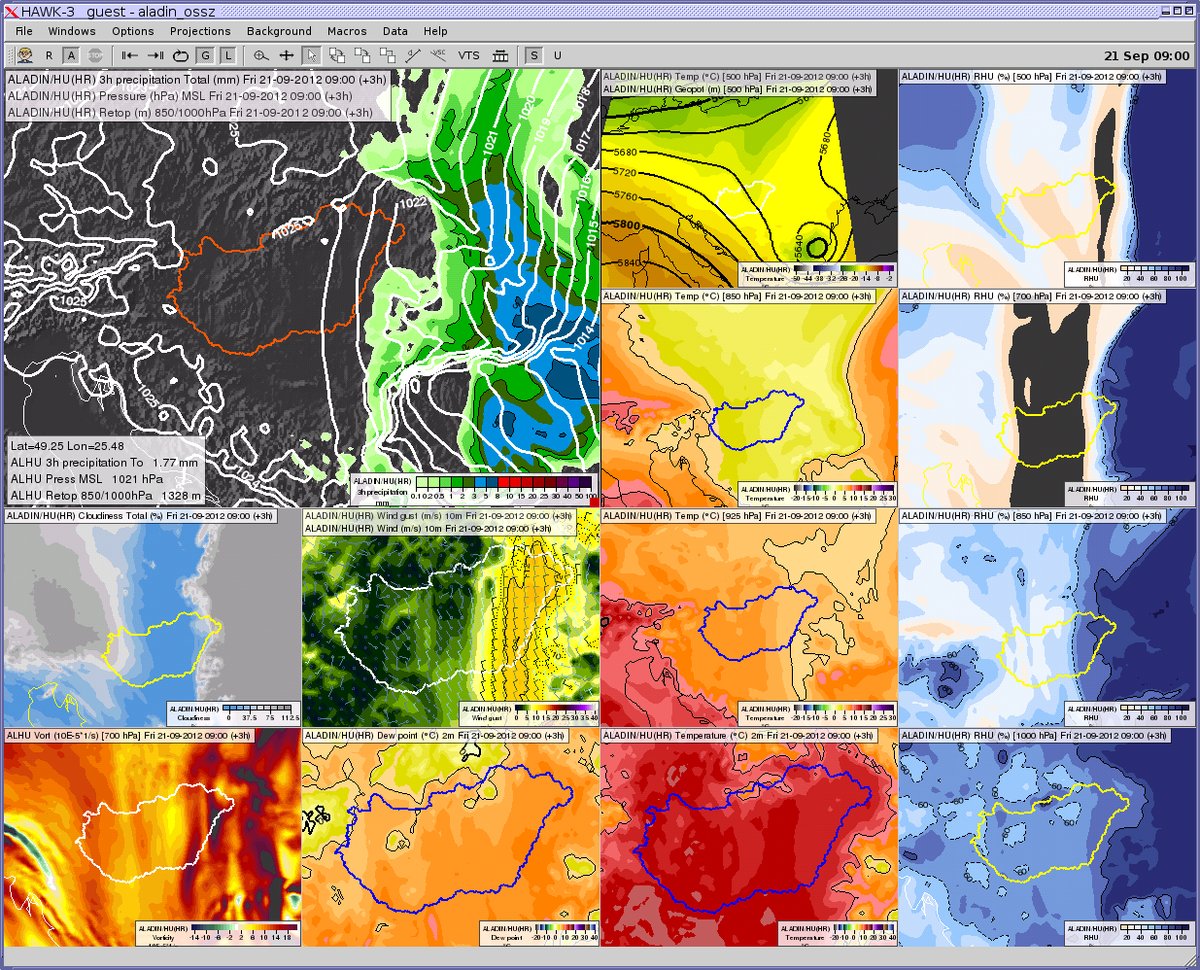
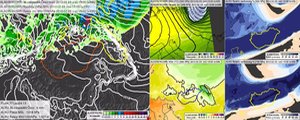
Visualisation of forecast fields in HAWK-3
The system’s primary users are the forecasters, but it is a useful application for research tasks, especially for case studies and for preparing charts for publications. Besides, most of the charts (e.g. Current weather, Forecast) of the new web site of OMSZ are prepared with HAWK-3.
Milestones of the development
Development of HAWK systems began in summer of 1994. The first operational version (HAWK-1), that was able to visualise radar and satellite images, surface and upper air observation and forecasts, was in use from 1998. A new, modernized version, the HAWK-2 was available for the forecasters from August of 2000. It had new functionalities compared to the first version, and it had an English version too since 2004. HAWK-2 system became a very popular application among forecasters, but further development of the software would have required serious reform, therefore setting up a new system was a more reasonable step.
Development of HAWK-3, the new system, began in 2005, forecasters tested it from 2009, and it is in operational use since 2011.
Main features of HAWK-3
Available data types:
- grid data (analysis or numerical prediction, on map and on vertical spatial or time section),
- radar and satellite images (single channels and composite images),
- surface observation,
- upper air measurements, radiosonde and AMDAR data (on map and on thermodynamic diagram with hodograph),
- lightning localisation data
- frontlines (with editing)
- picture data (e.g. webcam on map and as separated image)
Visualisation modes:
- map (6 built in projection type, and projection types of proj4 library)
- vertical spatial cross section
- vertical time section
- thermodynamic diagram (emagram, skew-t, tephigram, Stüve diagram)
Further features:
- arbitrary window arrangement, time synchronization among views
- export images, image series and animation
- data sampling, distance estimation, image zoom, pan, animation
- data layers are displayed on each others with arbitrary graphical settings
- derived data (operations principally on grid data)
- quick saving and reloading of user specific settings and views as macros
- automatic data refreshing
- printing
- non-interactive mode for automated image generation
- use of multiple processors/cores for computation intensive tasks
- extensible language support
- configuration synchronisation among workstations
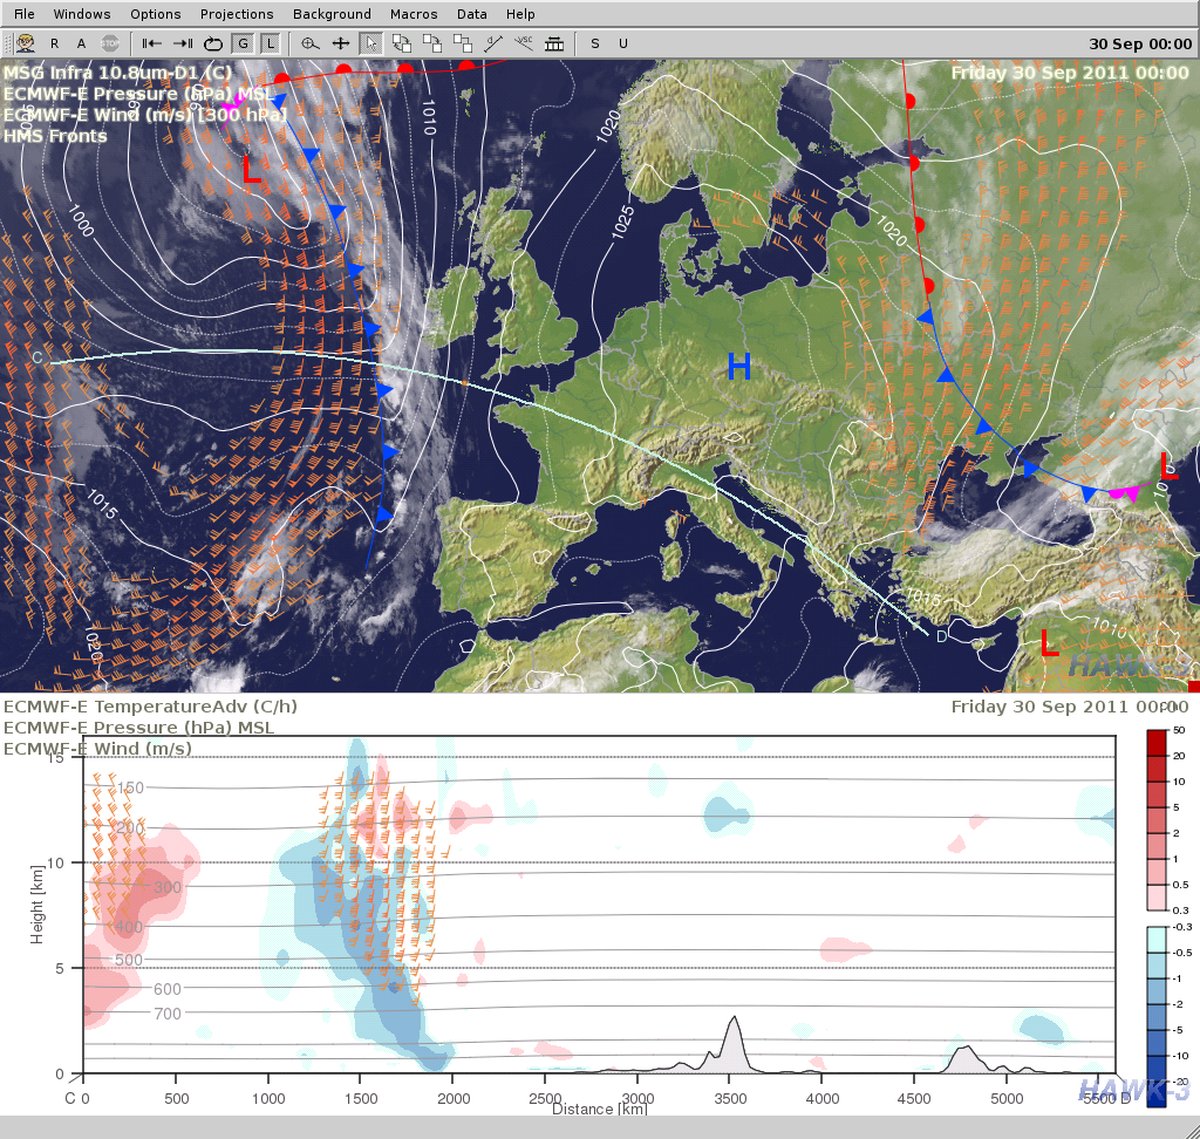
Vertical spatial cross section in HAWK-3
Upper window displays analysis fields and satellite image with front lines,
the lower window contains a vertical spatial cross section along the C-D line

Displaying radiosonde data in thermodynamic diagram
Plans
HAWK-3 is not able to display every kind of data that was available in the previous version. The most important and most often used data types and functionalities have precedence over other tasks at the development. Visualisation modes and data types expected to be ready in the next year are the following:
- Visualisation of trajectory and dispersion model outputs (used for tracking and predicting of air pollution).
- Meteogram (time cross section for a specific location e.g. for weather stations)
Further developments depend on the demand of forecasters, researchers.
Updated: 2012-10-01