Thursday 2 January 2025
Időjárás - Quarterly Journal of the Hungarian Meteorological Service (OMSZ)

Vol. 122, No. 4 * Pages 361–462 * October - December 2018
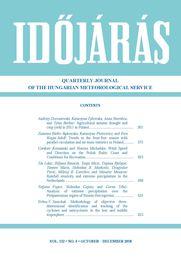

Quarterly Journal of the Hungarian Meteorological Service

download [pdf: 2129 KB]
Agricultural autumn drought and crop yield in 2011 in Poland
Andrzej Doroszewski, Katarzyna Żyłowska, Anna Nieróbca, and Tytus Berbeć
DOI:10.28974/idojaras.2018.4.1 (p. 361–)
 PDF (5061 KB)   |   Abstract

DOI:10.28974/idojaras.2018.4.1

Over the recent years, drought has been occurring with an ever increasing frequency in Poland. The longer the rainless period lasts, the more acute its impacts are. Agricultural drought manifests itself as a prolonged period of water shortage for agricultural crops during their growth season resulting in yield reduction. Extent of drought was evaluated by the climatic water balance (CWB). Climatic water balance is an indicator that determines the state of humidification of the environment using data measured at meteorological stations. It is defined as the difference between atmospheric precipitation and evapotranspiration (in millimeters) calculated by an empirical formula taking into account: temperature, sunshine, and length of the day. CWB was calculated using meteorological data from 294 weather stations and weather posts across Poland. Spatial data from point measurements were interpolated using the Geographic Information System (GIS) software. Yield forecasts were made for major crops in Poland using agro-meteorological yield models and weather indices (WI). Yield figures were based on data from the Central Statistical Office of Poland (GUS).
The autumn of 2011 was the driest in several dozen years in many localities of south-eastern Poland. For instance, at the weather station in Puławy, the lowest level of precipitation had been recorded since 1871. Weather conditions prevailing in the growing season of 2012 were very beneficial for winter cereals and winter rapeseed. As for sugar beet, the weather also favored high yields over most of the growing season, except the final stage of growth. Notwithstanding the extreme drought in the autumn of 2011, the good weather conditions in the remaining part of the growth period caused the yields of winter crops and sugar beet to be high.
The very scant autumn precipitation, even though it had negative impact on the germination of cereals, seedling emergence, and seedling growth, did not cause any major losses to yields. Water supplies from September precipitation combined with frequent morning mists, fogs, and dew mitigated the impact of prolonged drought and were sufficient to sustain the yields at an acceptable level.


Trends in the frost-free season with parallel circulation and air mass statistics in Poland
Zuzanna Bielec-Bąkowska, Katarzyna Piotrowicz, and Ewa Krępa-Adolf
DOI:10.28974/idojaras.2018.4.2 (p. 375–)
 PDF (3286 KB)   |   Abstract

DOI:10.28974/idojaras.2018.4.2

This study describes the regularities in spatial and multiannual variations in the occurrence of last spring frost (LSF), first fall frost (FFF) and the length of the frost-free season (FFS). In the paper, daily minimum and maximum air temperatures recorded at 20 stations in Poland in 1951–2015 and a calendar of synoptic situations were used. It was found that at 75% of the analyzed stations the FFS period grew longer and the changes were statistically significant. Clearly, the longer length of the season is attributable to the earlier LSF dates. The frosts under investigation were recorded most frequently in anticyclonic situations, especially in the presence of an anticyclonic wedge (Ka) and a central anticyclone situation (Ca). LSFs and FFFs were predominantly accompanied by arctic (PA), polar maritime old (PPms), and polar continental (PPk) air masses.


Wind speed and direction on the Polish Baltic coast and conditions for recreation
Czesław Koźmiński and Bożena Michalska
DOI:10.28974/idojaras.2018.4.3 (p. 393–)
 PDF (903 KB)   |   Abstract

DOI:10.28974/idojaras.2018.4.3

Using the results of daily measurements of wind from 6 meteorological stations (Świnoujście, Kołobrzeg, Koszalin, Ustka, Łeba, Hel) operated by the Institute of Meteorology and Water Management of Poland (IMGW) for the period 2000–2016, the study presents the assessment of temporal and spatial variation of wind speed and direction on the Polish Baltic coast with respect to conditions for recreation and tourism. For the purpose of assessing bioclimatic conditions, additional measurements were taken at 12 UTC in the period 2006–2015, which provided grounds for determination of thermal sensation using Hill’s index and heat load experienced by a person staying at the seaside. The analysis of wind speed and direction on the Polish Baltic coast shows high spatial variability and variation, which determines the stimuli character of this region. Considering thermal sensation expressed with Hill’s index, the most favorable conditions for recreation on the Polish Baltic coast occur in the Bay of Pomerania and the Bay of Gdańsk, favorable conditions are recorded in the area of Rewal to Dąbki, and less favorable in the area of Darłowo to Władysławowo.


Rainfall erosivity and extreme precipitation in the Netherlands
Tin Lukić, Biljana Basarin, Tanja Micić, Dajana Bjelajac, Tiemen Maris, Slobodan B. Marković, Dragoslav Pavić, Milivoj B. Gavrilov, and Minučer Mesaroš
DOI:10.28974/idojaras.2018.4.4 (p. 409–)
 PDF (2492 KB)   |   Abstract

DOI:10.28974/idojaras.2018.4.4

In order to assess the rainfall erosivity of the Netherlands, several parameters which describe distribution, concentration, and variability of precipitation were used (the annual amount of precipitation, the precipitation concentration index and the modified Fournier index), as well as eleven extreme precipitation indices (maximum1-day precipitation amount, maximum 5-day precipitation amount, simple daily intensity index, number of heavy precipitation days, number of very heavy precipitation days, number of days above 25 mm, consecutive dry days, consecutive wet days, very wet days, extremely wet days, and annual total wet-day precipitation). The precipitation data for calculating the above mentioned parameters is obtained from the Royal Netherlands Meteorological Institute for the period 1957–2016. Based on statistical analysis and the calculated values, the results have been presented with the Geographic Information System (GIS) to point out the most vulnerable parts of the Netherlands with regard to pluvial erosion. This study presents the first results of combined rainfall erosivity and extreme precipitation indices for the investigated area. Trend analysis implies a shift from being largely in the low erosivity class to being completely in the moderate erosivity class in the future, thus indicating an increase in rainfall erosivity. Furthermore, the observed precipitation extremes suggest that both the amount and the intensity of precipitation are increasing. The results of this study suggest that the climate conditions in the Netherlands are changing, and that this change might have a negative influence on the rainfall erosivity of the country.


Analysis of extreme precipitation over the Peripannonian region of Bosnia Hercegovina
Tatjana Popov, Slobodan Gnjato, and Goran Trbić
DOI:10.28974/idojaras.2018.4.5 (p. 433–)
 PDF (2693 KB)   |   Abstract

DOI:10.28974/idojaras.2018.4.5

Changes in extreme precipitation indices over the Peripannonian region of Bosnia and Herzegovina were examined. Data on daily precipitation during the period 1961–2016 from four meteorological stations were used for the calculation of 13 indices recommended by the Expert Team on Climate Change Detection and Indices (ETCCDI) for the climate change assessment. The precipitation change assessment covered trend analysis and analysis of changes in distribution. Determined patterns of change were neither spatially nor temporally coherent. The estimated trends in extreme precipitation indices were mixed in sign and mostly insignificant. Moreover, no significant changes in distribution of majority indices were determined. However, the upward trends in heavy precipitation indices RX1day, RX5day, R95p, and R99p indicate changes towards more intense precipitation. Understanding patterns of precipitation changes is of a great pertinence in many applied studies: flood risks management, agricultural planning, water resources management, environment conservation etc.


Methodology of objective three-dimensional identification and tracking of cyclones and anticyclones in the low and middle troposphere
Evhen V. Samchuk
DOI:10.28974/idojaras.2018.4.6 (p. 453–)
 PDF (1578 KB)   |   Abstract

DOI:10.28974/idojaras.2018.4.6

Extratropical cyclones and anticyclones are the main objects in researches of the large-scale atmospheric circulation processes in midlatitudes. In this context, new data which can improve our knowledge about theirtypical places of origin, tracks, and lifetime characteristics were critical.
The purpose of this research is to analyze existing methods and algorithms, used for cyclone and anticyclone identification and tracking, and to develop a three-stage methodology of baric systems identification in the low and middle troposphere based on a three-dimensional approach.
This research utilizes 40-year-long datasets of sea level pressure and geopotential height of three standard pressure levels up to 500 hPa covering the Northern hemisphere down to 20°N.
This paper presents a newly developed unified baric systems identification and tracking methodology. It is based on a step-by-step identification of isolated clusters of low and high sea level pressure and geopotential height throughout the low and middle troposphere from the ground level to 500 hPa pressure level. Centers of clusters on different levels for each moment of time are combined in a single vertical profile which represents one certain baric system. Tracking of the baric system movement is realized with nearest neighbor method, improved for more accurate detection and tracking of fast-moving short-living cyclones. In the process, a software was developed for the purposes of the automatic identification of baric systems in the Northern Hemisphere and for creating sets of cinematic schemes of natural synoptic periods. Also, a database of the baric systems existed during on the period of 1976–2015 on the Northern Hemisphere was created.


IDŐJÁRÁS - Quarterly Journal